This recovery is very unlike the past two recoveries of 1985 and 1995. In both previous recoveries, prices climbed to new highs and powered forward for 5 – 10 years. The two previous price moves forward were 1985 – 1990 and 1996 – 2006. In both previous recoveries, it was like a light switch was turned on and we never looked back. This time around, the light has been turned on but it flickers every now and then.
I have been trying to explain in a cogent manner the nature of this market. It is not a super strong market, nor is the 20% price bounce off the bottom something to take for granted. The major difference this time, is that rather than it being an unabashed recovery, we are recovering into a flatter market.
A flatter or changing market is hard to explain, mixed signals abound. In the last year many listings have been selling in days at full price, while other listings sit on the market in need of several prices reductions before eventually selling. This Hot and Cold market is by nature difficult to define. Our human psyche doesn’t like uncertainty, which is exactly what this market is providing.
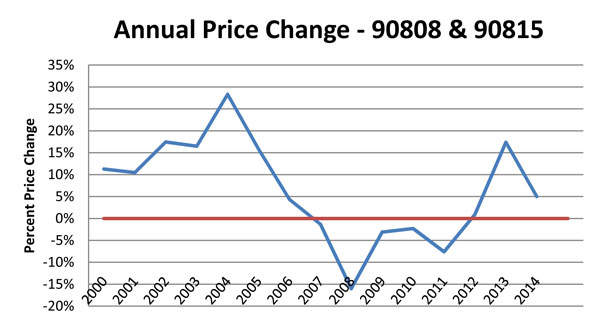
Rather than powering forward in one direction, the market has been changing directions and searching for the correct level, since the bottom of 2011. The bottom was firmly put in place by 4 years of falling prices ending in a relative undervaluation of home prices, relative to rent. The disappearance of distressed sales, foreclosures and short sales helped cement the bottom. Last year home interest rates dropped to 3.5% and buyers came off the sidelines and prices started to rise. Today however, prices are 20% higher and interest rates less favorable. Higher prices and interest rates has caused the market to slow from it’s big 2012 to 2013 price bounce of +17%.
Prices are still rising, but higher prices no longer seem a sure thing. Price gains are moderating and the volume of sales activity still remains recession like low.
To look at the nature of the market one needs to get into the head of a buyer. The typical buyer knows that the market has bottomed, which is a good thing. They also know that rates are still very low at around 4.5% which is very good. They are frustrated with the low inventory, which creates a sense of urgency when a good home does appear. Therefore some new listings can attract multiple offers or at least one motivated buyer that has been waiting.
That is the positive spin on the market. The negative spin on the market is that prices today are not as appealing as they were several years ago. Between the higher rates and the higher prices, properties are effectively about 30% more expensive today. This is a big jump. While the economy is technically in a recovery, many people still feel nervous about the solidity of their own personal finances. Buyers are aware that the climb in home prices has slowed, and rates, having already bounced, are likely to stay lower. If prices and rates are likely to be stable for the immediate future, then there is no need to jump on a home that is anything than ideal. So buyers today, can be picky, and are willing to pass on anything that doesn’t strike them as a deal, or an emotional “must have”.
For this reason the market seems quite Bipolar. In conversations with other agents regarding the state of the market, most agree that they can’t figure this market out. It is that confusing to make a confident directional call. This uncertainty bleeds over to the market for a given home, as it is often hard to tell whether a new listing will sell in days at full price, or will receive luke warm response and need several price reductions.
So what is contributing to an the inability to “Figure It Out”? Here are some contributing factors:
1) A flat or Normal Market goes against our psyche.
Humans like certainty. We don’t like grey. We prefer black and white, good and bad, or up and down. Being in Real Estate, I am often asked “How is the market?”. Even I don’t like having to answer this question now. There is no simple answer. To illustrate this uncertain outcome, many of our recent sales have sold in days at the top of the market, with multiple offers and overbids. In other instances, the market wasn’t so kind, and buyers wanted significant price discounts before offers where obtained. In summary, I either look like a hero or failure. Not a fun uncertainty. But this above example is more an explanation of the situation, rather that a contributing factor.
2) The market is thinly traded.
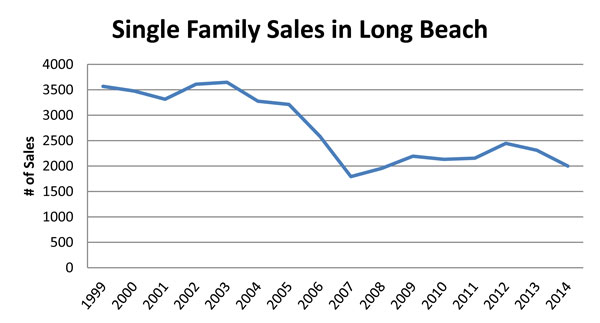
This is more of a contributing factor. What do I mean by thinly traded? There are not a lot of buyers or sellers in the marketplace. It is likely that you have heard there are not many homes on the market, which is true. Balancing this lack of supply is an equally small number of motivated yet cautious buyers. Look at the chart above, “Single Family Sales in Long Beach”, there you can see that despite prices rebounding, the number of sales has stayed towards the lower end of the range, nowhere near the previous volume of years 1999 through 2005. When market volume is low, there is greater volitility.
How does this affect individual listings? As an example, Since there aren’t a lot of homes on the market, buyers flock to new listings to see if it is their dream home. It is not unlikely that a home will get 3 offers. Sometimes these three offers results in the price getting bid up. But equally as likely, only one of the 3 offers is good, and the other two offers fall by the wayside. Maybe one offer is a low ball and the other doesn’t want to enter a bidding war. Even multiple offers are not a guarantee that negotiations will go in a seller’s favor.
With the lower number of listings and buyers, homes price negotiations are more susceptible to uncertainly. When the market is unequivocally strong, multiple offers produce bidding wars, and when the market is weak, multiple offers don’t exists. This in between market produces offers with VERY mixed results, hot sometimes, cold others.
3) There is a greater range of volatility within a given market.
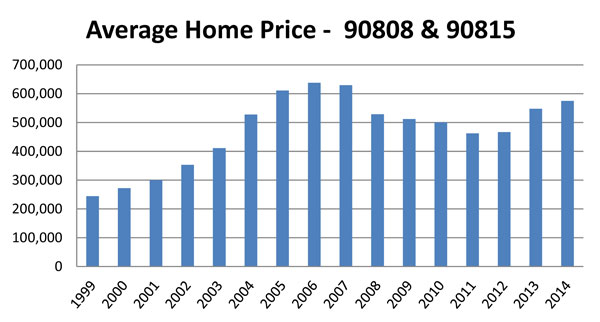
This is in essence a corollary of the above. What I specifically mean is for a given market there is now a greater range of value between the low end (fixer upper) versus a home that is completely upgraded. As an example. Take a 3 bedroom two bath home with a family room (about 1,600sf) in the East Long Beach area (zips 90808 & 90815). A home with these specifications might vary between $450,000 and $750,000. Certainly there will be a dramatic difference between the two. The $450,000 home is likely to be a distressed sale that wasn’t marketed correctly and could have sold for more. It needs work and likely has many flaws. The $750,000 home might be a complete remodel just done recently with top quality finishes and presented in a very appealing manner. So there is a significant difference between the $450,000 and $750,000 home. But $300,000 is a HUGE range. Typically this market might have only varied by $150,000 in previous years.
If you have a market with a range of $150,000 and you can correctly assess whether your home is a fixer (maybe a 3 out of 10), or average a (5 out of 10) or a at the top of the market, you aren’t going to be more than about $20,000 off the mark. Then gauging market feedback and offers helps you narrow in an already reasonable ($20,000) uncertainty. But when the range of values is $300,000 for a given market, even when you can correctly assess your homes quality and value, there is a $50,000 market uncertainly. A list price $50,000 too high will certainly cause a listing to just sit there and not sell, but if there is the possibility of $50,000 more in my clients pocket, I want to help achieve that goal. Hence why I can look like a hero or just foolishly optimistic.
4) The Federal Reserve is messing with normal market operations, causing mixed signals.
There is a lots of cash on the sideline looking for a place to hide, specifically a home with any type of returns. With banks paying nothing, people with cash are forced to speculate. It is impossible for me, or anyone to quantify just what interest rates and home prices would be if the Federal Reserve stepped aside. But here are some simple questions to ask. With around 80% of loans being sold to GSE (Government Sponsored Enterprises – Fannie Mae etc.) is it likely that without this support, mortgage requirements might be stricter and rates higher. In addition, if interest rates were higher and an investor could earn a safe yield of 5%, there might be less buying through simple speculation.
It is impossible to say what the equilibrium of the market (home prices and interest rates) would be without Federal intervention, but it WOULD BE equilibrium. When there is Federal stimulus, equilibrium is artificial. Investors anxiously try to second guess the Feds next move. Might the Federal Reserve see inflation as a threat and decide to raise rates, might they continue to print money to keep rates down. Last year we saw that market slow dramatically when Bernanke just hinted that “maybe, someday in the future the Fed might possibly begin tapering quantitative easing”. This simple statement caused rates to jump about 1% from 3.5% to 4.5%. This simple statement of inevitabilty on the part of the Fed Chairman, caused buyers home payments to become 10% more expensive. If Real market forces were in control of interest rates, the Fed Chairman breathing the wrong words would not cause interest rate shock. It is this type of intervention that causes greater market unease and volatility. Just how much this contributes is impossible for anyone to say.
5) We have just been through an inflection point and the market is seeking equilibrium.
This as well is a corollary to the above, but it deserves it’s own investigation. As you can see from the attached charts prices bottomed in 2011 and been climbing ever since. What you may not know is that volatility around market inflection points often tends to be greater. Stock charts after market shocks often look like “Dampened Sine Waves”. A “Dampened Sine Wave” can be imagined by pushing down on a cars suspension, or the graph of a earthquake. The initial shock is great and then moves back and forth slowly subside with each subsequent swing.
Many recoveries of the past have been complete trend reversals, where once prices bottomed we were off to the races again. This recovery feels more like the example above. The initial shock or earthquake was in the 4th quarter of 2007, with the start of the credit crunch. Then the reversal was in 2011 with prices bottoming, and now that prices have popped up by 20% and rates have risen, we may see a temporary softening in the market.
If you look at the chart “Single Family Sales in Long Beach”, you can see that 2012-2013 saw a small decline in the number of sales. In 2014 we are seeing a continuation in this trend, although for a complete disclaimer, I have prorated / guesstimated 2014’s sales activity based upon the first 6 months. The number of home sales is often a precursor to price changes in the same direction.
So as we bounce back and forth between market highs and market bottoms, the market (ie. buyers and sellers) are trying to determine the correct value of homes. This uncertainty is only magnified by the Feds intervention. While some may argue that their intervention has been good, as it helped put a bottom in place for the housing market, and left many current homeowners with favorably low home payments from refinancing at lower rates. It is fair to argue that their is never a free lunch, and savers with money in the bank have lost most of their interest income.
Summary
The market’s bounce off the bottom was VERY pronounced. During the spring of 2013, multiple offers where the norm, resulting in a 17% price increase (2012-2013). Moving forward however, I think it is more likely that the housing market will be moving forward at a slower pace, often throwing off mixed signals.
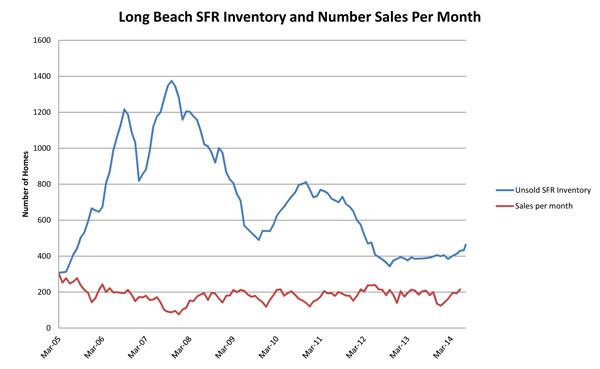
Chart Analysis in Favor of a neutral market:
1) See chart below – Inventory is rising just slightly, this is often a precursor to a slowing market.
2) See chart previous page (top) – The number of sales has been low relative to the boom years, hasn’t risen much from the market bottom and is sligthly weakening.
3) See chart previous page (bottom) – Annual Price Change – While the bounce off the bottom was very pronounced, price increases have slowed dramatically this year.